How to systematically measure and drive Word of Mouth acquisition
This post was written by Yousuf Bhaijee. Additional insights provided by Tomas Pueyo (VP Growth @ CourseHero), Michael Taylor (Co-Founder of Ladder) and Phil Carter (Growth Product Lead @ Quizlet).
This article was first published on www.reforge.com. Link
It’s pretty standard advice. Word of mouth is critical to growing a successful product. Despite its importance, word of mouth has always been hard to measure and therefore hard to influence.
In 2014 I worked at Zynga with Tomas Pueyo (author of coronavirus articles with 50M+ views) where we started looking at word of mouth acquisition. Through our journey, we created a simplified way of measuring word of mouth that was stable enough to use in forecasting and insightful enough that teams could figure out how to influence it. Since Zynga, I teamed up with Mike Taylor (co-founder at Ladder) to apply this method to products across a range of categories and have found it to be impactful for teams.
Before we get started, sign up here to receive occasional future posts on word of mouth, growth marketing/product, and tips on growing your business and career
Why Word of Mouth Is Becoming More Critical
Channel saturation, more competition, and platform openness are getting worse. This means fewer opportunities and worse customer acquisition economics in the opportunities available. A few of the recent trends:
Facebook, Google, Amazon advertising dominance - 40% of all venture capital, and 70% of a company’s digital ad budget is spent on these 3 platforms.
Apple is killing user advertising IDs - Apple has recently killed user advertising ID’s. Google has similar plans. This means performance marketers will have less visibility into what is working, reducing ability to optimize cost effectiveness.
Google Search decreasing real estate - Google continues to decrease the prominence and presence of organic search results in addition to decreasing the need for a user to click out of the search results.
As these channels become more crowded and less cost effective, the importance of Word of Mouth becomes even more critical to drive user growth.
Hard To Measure, Hard To Influence
Word of Mouth is notoriously hard to measure because most of a brand’s Word of Mouth happens offline. Online social media, the most measurable form of Word of Mouth, is only the tip of the iceberg. 80% of online sharing happens through dark social (sharing via untracked channels like whatsapp, text, and email)!
But that hasn’t stopped people from trying to measure word of mouth. There are a few common methods that companies use, each with their own major drawbacks.
NPS - Most companies already try to measure the word-of-mouthiness of their existing users through NPS, but can’t quantify actual growth impact. In addition, just because someone says they would recommend to a friend, doesn’t mean they actually do.
Attribution Surveys - Another major method is to ask new users how they heard about the product. These attribution surveys suffer from low response rates and respondent bias--the users who respond are different from the ones that do not.
Social Listening Tools - Social listening tools crawl social platforms and the web to track mentions and engagement. These miss dark social and offline word of mouth.
This difficulty of measurement has made improving word of mouth difficult. Everyone has heard the saying, “You manage what you measure.” Since Word of Mouth is very hard to measure, it leads to multiple challenges for companies:
Teams Ignore It - Product and marketing teams decide to ignore word of mouth acquisition.
Lean on Paid - Marketing teams continue focusing on paid acquisition because it is easier to measure and influence, even when it may not make sense.
Less Capital Efficient - Many companies end up overly reliant on less efficient channels leading to poor unit economics and larger capital needs.
So we know that Word of Mouth is critical, but notoriously hard to measure, and therefore hard to influence. As a result, we set out to create a metric that:
Measures Word of Mouth as a function of what drives it.
Is stable enough to use in forecasting.
Is able to be influenced by product and marketing initiatives.
Enter the Word of Mouth Coefficient.
The Word of Mouth Coefficient
The starting point when we looked at word of mouth acquisition on 2014 was a common monetization metric called ARPDAU (average revenue per daily active user).
ARPDAU tells you how valuable an active user is in terms of revenue. It’s a valuable growth metric for three reasons:
It’s tied to active users - a user metric every company tracks
It’s a stable metric - you can use it to forecast confidently
It can be influenced - you can break it down to its inputs and influence it with product and marketing activities
We wanted to achieve something similar around Word of Mouth. So we created a metric called NOPDAU or “New Organics Per Daily Active User.”
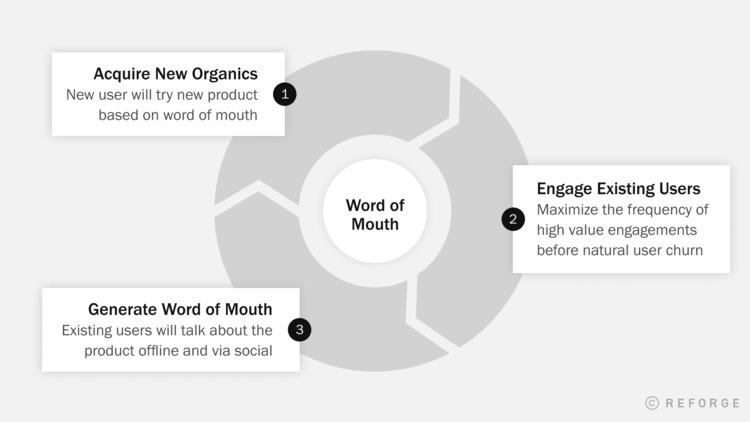
The premise was simple: the people who are actively engaged with your product, talk about your product--and at a fairly consistent rate. The longer you engage your users, the more word of mouth they generate. In other words, product retention drives growth of new organic users.
NOPDAU shared the same key benefits as ARPDAU. It was tied to active users, it was a stable metric, and we could influence it with product and marketing initiatives.
After Zynga I teamed up with Mike Taylor (co-founder at Ladder) to broaden this concept beyond DAU and for other industries, to what we now call the Word of Mouth Coefficient (or WOM coefficient).
Word of Mouth Coefficient: The WOM Coefficient tracks the rate that active users generate new users via word of mouth, similar to how ARPDAU tracks the rate that active users generate revenue.
For example, if the denominator of your WOM Coefficient is WAU (weekly active users), and the coefficient is 0.1, that means every WAU generates 0.1 new users per week via word of mouth. Or in simpler terms, for every 10 weekly active users, they will generate 1 new user via word of mouth.
The Word of Mouth Coefficient has two components:
New Organic Users: First time product users that we consider to be driven by word of mouth (i.e. they can't be traced to any trackable source such as a paid digital ad). This is the numerator and what we are trying to predict.
Active Users: The denominator of the ratio is everyone else: Returning Users + Non-Organic New Users. The time period depends on your retention metric. For most products it is typically Daily, Weekly, or Monthly Active user.
In our follow up post, we’ll walk through these step by step in more detail.
Active Users Predict WOM
At the center of the Word of Mouth Coefficient is the assumption that active users predict new organics. This conceptually makes sense. Active users are more likely to talk about your product than those who have never used it or have stopped using it. This is because Word of Mouth works as a Growth Loop and retention is at the core of all growth loops.
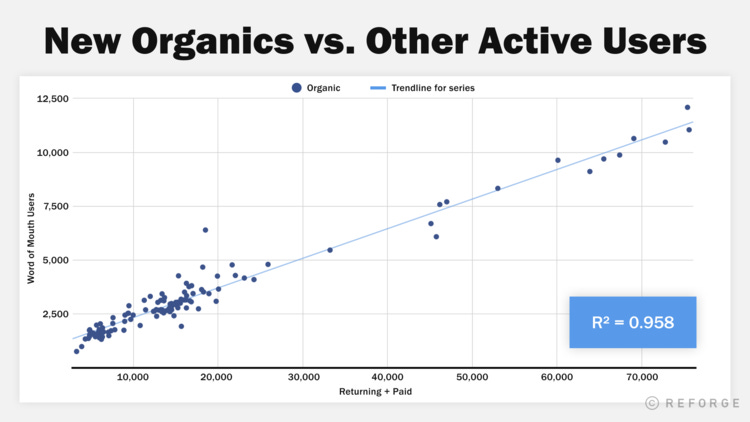
Data supports this relationship. We have analyzed the WOM coefficient across multiple companies and industries so far. Here is an example from 3+ years of weekly active user data from an e-commerce company. The data is arranged in a scatterplot and shows a strong linear relationship between active users and new organics with an R squared of 0.958. The relationship holds, even when weekly active users jump from 10,000 to 70,000 (a 7x increase)!
Why This Is Different
The metric that most people associate with viral loops is k-factor. The simple equation for k-factor is k = # of invites sent by each user * conversion rate of each invite. It tells you for each new user, how many additional new users you expect the viral loop to generate.
There are few differences with the Word of Mouth Coefficient, but the two most important:
K-Factor Doesn’t Solve WOM - K-Factor was popularized during the early social network and social gaming days where the main viral mechanism were viral invite flows that were highly trackable. Word of mouth by nature is hard to track. But even more important is influenced by different things.
Active Users As The Input - Most viral growth models are focused on new users as the input, not returning users. Here are two good examples: Andrew Chen’s and David Skok’s. Switching to active users as the input for modeling virality, however, leads to very different strategic recommendations. Instead of focusing on new users, you shift to build your strategy around engaged users.
The Word of Mouth Coefficient In Mobile Gaming
Here is an example of what you would have seen if you looked at the WOM Coefficient for a typical mobile game in 2016.
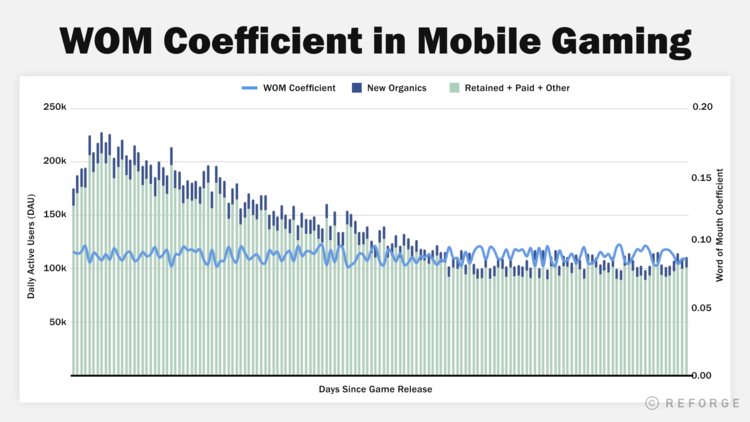
As you can see in the chart above, the WOM Coefficient is remarkably consistent at different levels of new and active users, one of our important criteria in creating a reliable metric.
Each mobile game has its own lifecycle, starting with a large acquisition push followed by slowly diminishing DAU. But the WOM Coefficient mostly stays stable even as DAU slows.
One other important conclusion is that it shows one way to increase word of mouth is by increasing retention. In this game,better retention leads to more total DAUs during the life of a user. One extra DAU drives ~0.09 incremental new organics on any given day.
You might look at this and think new organic acquisition is trivial compared to other areas of focus, but that is misleading. Each “new organic” is worth multiple future DAUs as those new organic users retain and the word of mouth loop spins.
The Word of Mouth Coefficient Varies By Game
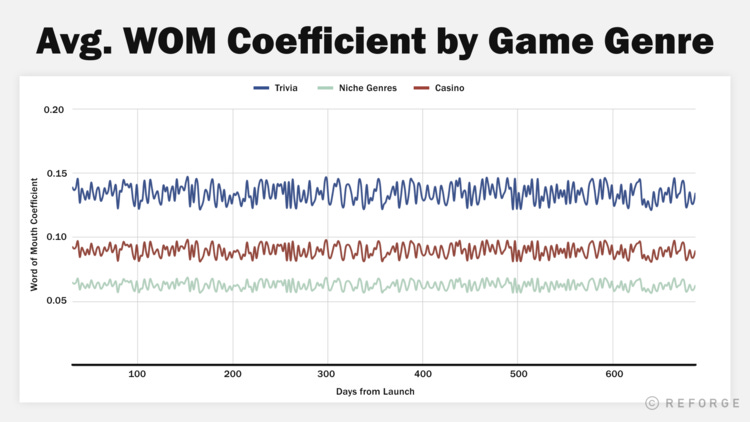
The Word of Mouth Coefficient varies by game. In the chart below, you can see the WOM Coefficient for three different games in three different genres. For a trivia game the ratio was around 0.14, for a casino game it was about 0.08, and for a niche game, it was 0.06.
The Product and Marketing Implications Are Meaningful
When gaming companies decide what games to build they choose a genre (e.g. casual, casino, midcore) and build a growth model to project user, revenue, and profit before greenlighting development. The more sophisticated developers build their growth models to be driven by retention, monetization, and paid CPA benchmarks.
After game development is complete, these projections are measured with a soft launch in Canada. If the game performs below these benchmarks the team works on optimizing retention, monetization, and paid CPAs before investing heavily in a global launch (because users will only download a gaming app once). However before the Word of Mouth Coefficient, organic acquisition was a hand wavy forecast that was never verified--even though organics were such a large driver of growth. Depending on where the WOM Coefficient performs, some key business decisions could be made on whether or not to double down on a game or kill it.
The Word of Mouth Coefficient For A $1B+ Edtech Company
Edtech is a category where optimizing in-product viral flows can be notoriously difficult for products targeting teachers. This is because teachers mostly share with each other offline. Specifically, they walk into another teacher’s classroom or present in a staff meeting. Yes, teachers use Facebook and emails to share what they like (they are human!), just not when sharing Edtech tools. A growth team could spend time and effort on optimizing these viral flows, but it is a lost cause as they spread the product via word of mouth outside of the product experience.
To further explore companies that benefit from word of mouth in Edtech, we looked at the WOM Coefficient for one of the largest and fastest-growing Edtech products in the industry, and identified a number of interesting patterns:
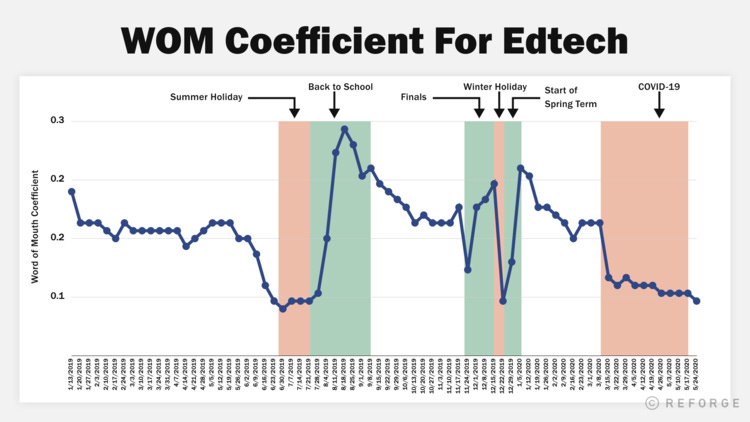
WOM Coefficient - United States: Jan 2019 - May 2020
Stability: WOM Coefficient is relatively stable during the school year, with each WAU generally bringing in an additional ~0.15 new organic user in an average week.
Seasonality: However, WOM Coefficient fluctuates seasonally based on school calendars. Specifically, the ratio rises during periods when students and teachers are returning to class and actively talking to all of their peers about online study tools. WOM Coefficient nearly doubles in August with the start of the all-important “Back to School” period, and spikes again in January as students return from winter holidays. Conversely, the ratio falls during summer vacation because most students and teachers are out of class. The product is just as shareable during these periods, but the average active user during summer has fewer people to share it with, so WOM Coefficient naturally declines.
Sensitivity: WOM Coefficient is also sensitive to external forces like the COVID-19 pandemic, which caused organic word of mouth to drop in the US this spring as several states struggled to adapt to remote learning and some K12 districts shutdown entirely.
Unsurprisingly, COVID-19 impacted this company’s WOM Coefficient metric differently in countries like Poland and Italy that quickly transitioned to remote learning. In these markets, WOM Coefficient saw an initial spike in March with local onset of the pandemic as teachers and students shared this Edtech product to support remote learning, and maintained a higher average the rest of the school year before declining again as students and teachers left for summer vacation.
Word of Mouth Coefficient - Poland and Italy: Indexed to January 2020
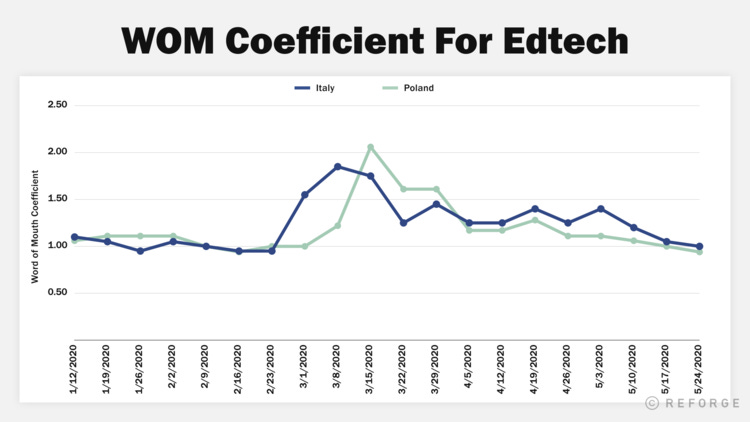
By analyzing WOM Coefficient, both seasonally within a given country as well as across countries, this company is identifying multiple opportunities to supercharge organic word of mouth and accelerate international user growth.
The Word of Mouth Coefficient For Other Applications
What about products that heavily rely on paid acquisition? Below you see data on the WOM Coefficient for a software product that helps you learn how to play piano. It has an iTunes like store where you can purchase interactive tracks to learn using their software and a digital keyboard. The company heavily relies on paid acquisition as the majority of their channel mix.
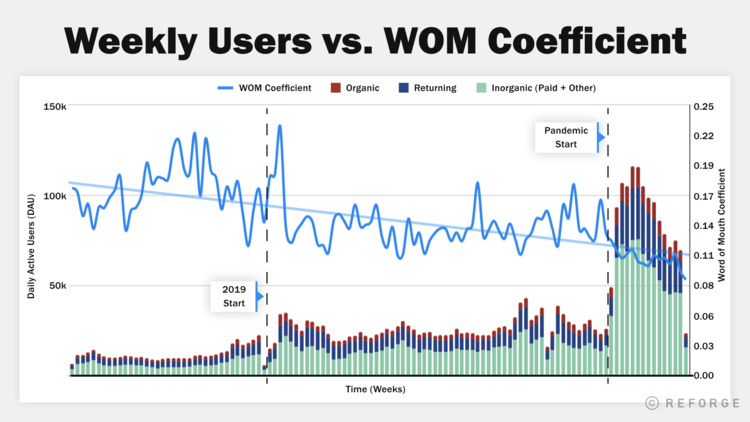
A few observations from this chart:
WOM Coefficient decreases when scaling paid acquisition - Paid acquisition has scaled 3 times since 2018, with the most recent step function change occurring during the pandemic. Each scale point results in a lower WOM Coefficient. This same pattern happens for other core metrics (such as retention, monetization, virality) in e-commerce companies that scale. The more you scale paid, the lower quality the user.
WOM Coefficient becomes more stable with volume - As volume increases, the month to month volatility decreases. But even in its most volatile state, the range is pretty narrow, once again making it a decent metric to use for forecasting.
Using and Improving The Word of Mouth Coefficient
So far we’ve covered a lot of key points:
Word of mouth is becoming more critical, but notoriously hard to measure and therefore act on as a team.
The Word of Mouth Coefficient is a different way to measure word of mouth, and is useful for a few reasons:
It’s a function of active users. Active users predict new organic users better than other inputs.
It is stable enough to use in forecasting.
We were able to find the inputs and influence it with product and marketing initiatives.
The Word of Mouth Coefficient can be used across various product categories with different dynamics.
In a second part of this series, we’ll explore questions like:
A step by step to measuring and validating the Word of Mouth Coefficient for your product.
How to uncover the inputs into the metric so that you can design product and marketing experiments to influence it.
How to understand whether your Word of Mouth Coefficient is bad, good, or great.
Subscribe here to receive the next post in this series and other insights by leaders in the Reforge Network. If you are working on virality (or want to learn how to) reach out to Yousuf directly on Linkedin.


Hi Yousuf, first, I expected this to be info-packed, and it was just that.
I feel like there is some degree of inaccuracy that is inevitable for any brand using the coeffecient.
Here's what I mean:
The customer journey is more complex than ever with users going across devices and going from one channel to another, which is recking attribution as we know it.
So if a customer sees an influencer campaign, doesn't click on the link to go the website, goes to google to check the brand on their own and then clicks from Google (using a branded search) to view your website then decides to signup. Here we'd attribute them as organic users although they came from an influencer collaboration we paid for, they just weren't attributed to that campaign.
Now imagine we are running multiple paid acquisition channels, affiliate marketing and partnerships, etc. Their will be a good amount of users that will come to us were they first heard about us from a paid channel, but then are attributed as organic since they didn't click on the link, they visited us directly/using branded search.
So as a company scales more channels, the degree of inaccuracy of the coefficient will increase. That will make it hard to see the tipping point for a company, the number of organic users who are actually coming from WOM.
And as you previously stated, attribution surveys have biases so they aren't a good measure of WOM.
As you said, with Zynga, isolation of channels (only using WOM to fuel acquisition) made the metric very accurate.
However, if a company has paid CPA goals (as stated in this blog post) and are testing paid acquisition channels, so going beyond WOM, it will start to increase that degree of inaccuracy. So Zynga would have increased that degree of inaccuracy had it introduced new paid channels.
Your thoughts on this would be greatly appreciated. Thank you.